The Quantum Signature of Hydrogen
Scientific Data Analysis
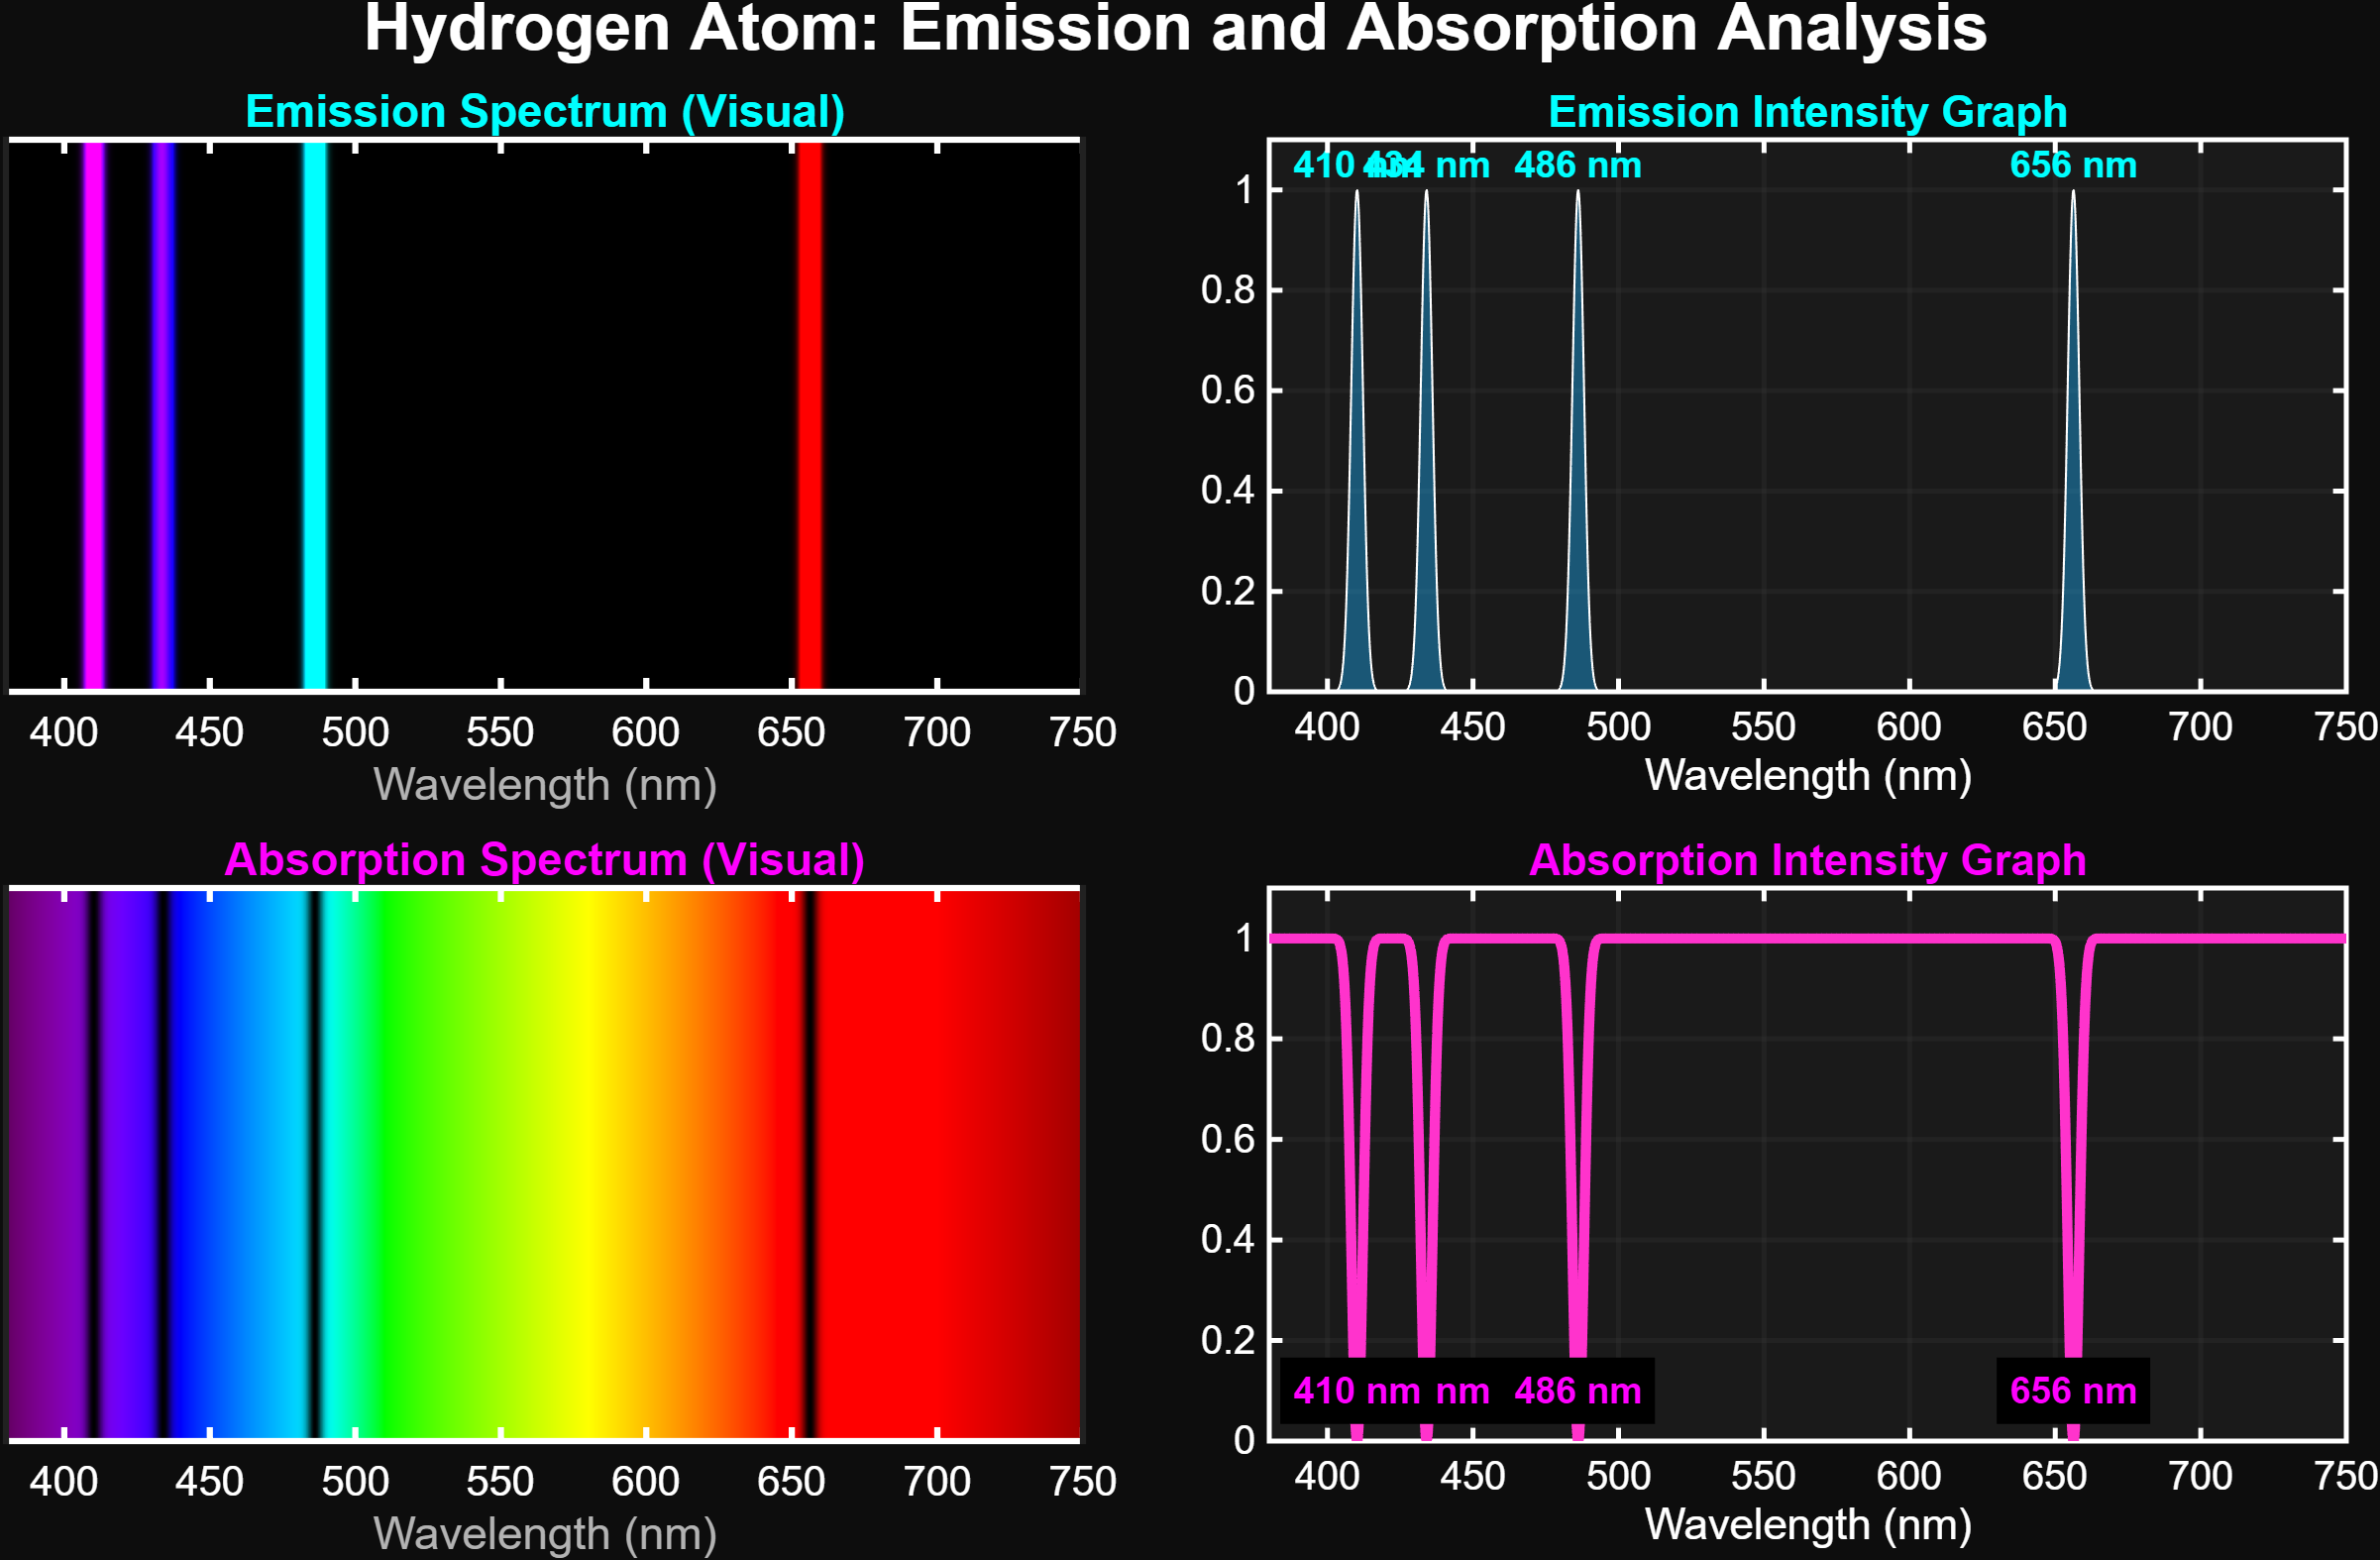
*The graphs above were generated using a MATLAB algorithm developed for this project and represent the mathematical data of the Bohr Atomic Model (Balmer Series).
1. Emission: Neon Lights of the Universe
The colored lines and sharp peaks visible in the top panel of the graph represent the "Emission Spectrum".
Just like in the 3D animation you witnessed; when an excited electron falls to a lower energy level, it releases the energy difference as a photon (light). Glowing nebulas in deep space or neon signs on the street operate on this principle. It is the atom's unique colors glowing against the darkness.
2. Absorption: The Light Thieves
The black bands and deep dips across the rainbow in the bottom panel of the graph represent the "Absorption Spectrum".
If light from a star passes through a cloud of cold hydrogen gas, the hydrogen atoms "swallow" only the specific frequencies they love (656nm, 486nm, etc.). When the remaining light reaches us, those swallowed parts are missing. These dark lines are essentially barcodes that allow us to read the identity of stars.
3. The Balmer Series and Fingerprint
H-Beta (486 nm): Turquoise line. (Transition from 4th to 2nd orbit)
H-Gamma (434 nm): Blue line. (Transition from 5th to 2nd orbit)
H-Delta (410 nm): Purple line. (Transition from 6th to 2nd orbit)
Each peak or dip in the MATLAB graph corresponds to these precise transitions in the atomic world. These four lines are the unchanging signature of the Hydrogen atom, no matter where in the universe they are found.